
For some time now, diversification felt more like a liability than an advantage. A select group of US mega cap growth stocks, led by the “Magnificent 7”, accounted for the bulk of market returns. Investors with exposure to non-US equities, small and mid-cap stocks, or value-oriented strategies – segments largely disconnected from the AI theme – were left waiting for broader leadership to reemerge.
The start of 2025 marked a notable shift in this narrative with non-US equities taking the lead amid geopolitical tensions, a weakening US dollar, rising fiscal support abroad, and an overall reassessment of "American Exceptionalism." Momentum continued to broaden into 2026, as US small cap and value stocks joined the advance. Sector participation has widened as well, with seven of the 11 sectors outperforming the S&P 500 to start the year, led by cyclical groups including Energy and Materials. The seemingly forgotten benefits of diversification are once again becoming increasingly apparent.
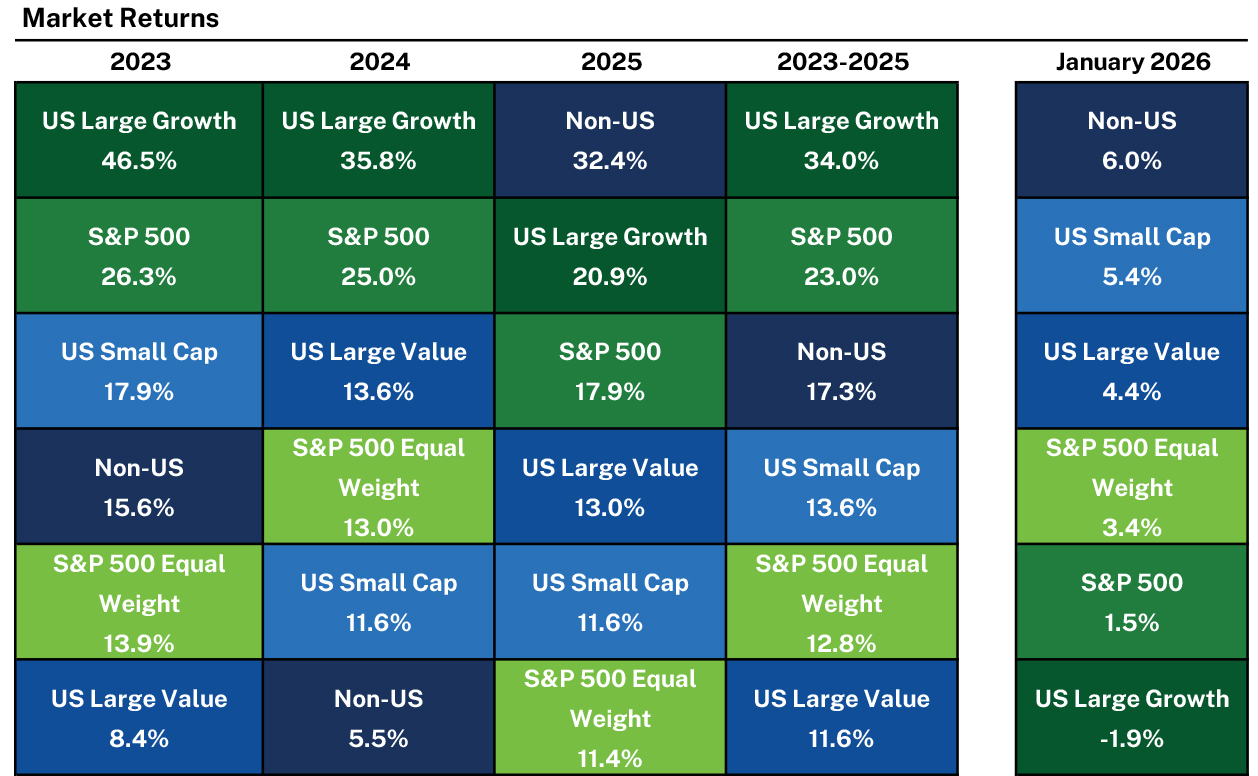
Source: Morningstar, Inc. US Large Growth is represented by MSCI USA Growth. US Small Cap is represented by MSCI USA Small Cap. Non-US is represented by MSCI ACWIxUSA. US Large Value is represented by MSCI USA Value.
This would not be the first time investors have heard talk of a regime shift. Similar narratives surfaced repeatedly over the past decade, only to fade as US mega cap growth stocks reasserted their dominance. So why might this episode be different?
The key distinction is policy.
Unlike many technology companies, most of the other sectors within the equity market are more sensitive to traditional policy tailwinds or headwinds. Broad market participation typically emerges when overall policy stimulus is rising, not falling. Today, both fiscal and monetary policy appear sufficiently supportive to sustain the breadth of market leadership that we’ve seen begin to emerge.
On the fiscal side, stimulus is accelerating meaningfully. According to the Hutchins Center Fiscal Impact Measure, fiscal policy is projected to add roughly three percentage points to GDP growth in the first quarter of 2026. This reflects a combination of delayed federal spending now reaching the economy and the impact of tax cuts under the One Big Beautiful Bill Act. Beyond headline tax relief, stimulus is already flowing through retroactive refunds, sizable subsidies and tax incentives for companies reshoring manufacturing, and other targeted spending initiatives. More recently, the administration has floated the idea of tariff dividends for lower- and middle-income households, a policy that would further support consumption if implemented.
Monetary policy is likely to remain a tailwind as well. While most rate cuts are likely behind us, financial conditions remain broadly supportive of growth. Markets are currently pricing in two additional cuts this year, with the potential for more if economic momentum softens. Crucially, policy is no longer actively restrictive, an important backdrop for smaller companies and more cyclical areas of the market.
These policy tailwinds are increasingly evident in earnings expectations. Growth for the Magnificent 7 is moderating from exceptionally high levels, as surging capital expenditures raise questions about when and how much revenue will ultimately materialize. Meanwhile, earnings growth across the rest of the S&P 500 is gaining momentum, while small cap earnings are expected to accelerate even faster, supported by easing financial conditions and stronger domestic demand. Not only is earnings growth broadening, but it is doing so from valuation levels that remain far less demanding than US mega cap growth and below their own long-term averages, enhancing upside return potential.
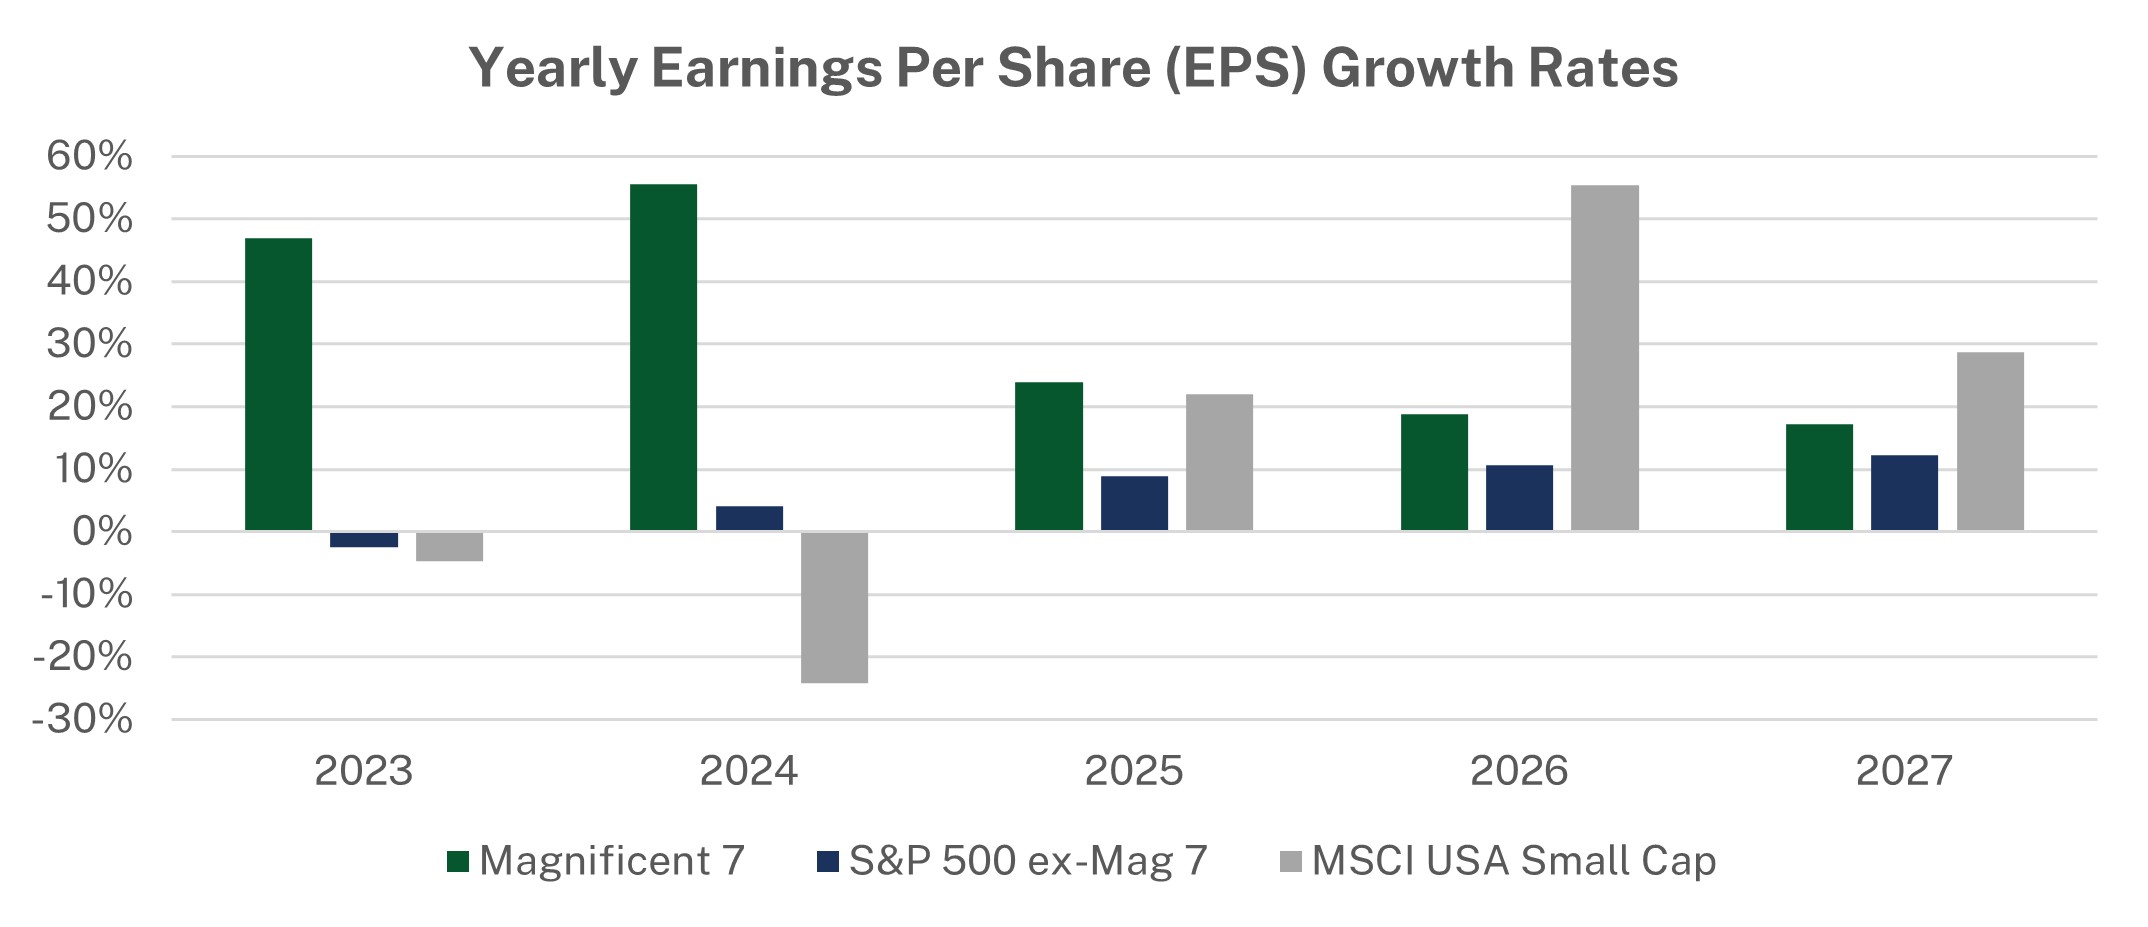
Source: Bloomberg.
From our perspective, the potential for broadening earnings growth and the resulting diversification of market returns are healthy developments. Bull markets rarely end when leadership expands; rather, they tend to end when growth collapses, or policy tightens aggressively. As this bull market enters its fourth year, a wider set of contributors may be exactly what is needed to sustain it.
We're here to help
We're always available if you'd like to schedule a call with a member of our team to talk about the current environment, solutions we offer, or other questions top of mind for you.
Schedule a callThis material contains the opinions of Manning & Napier Advisors, LLC, which are subject to change based on evolving market and economic conditions. This material has been distributed for informational purposes only and should not be considered as investment advice or a recommendation of any particular security, strategy, or investment product.
Information contained herein has been obtained from sources believed to be reliable, but not guaranteed.
The S&P 500 Total Return Index is an unmanaged, capitalization-weighted measure comprised of 500 leading U.S. companies to gauge U.S. large cap equities. The Index returns do not reflect any fees or expenses. The index accounts for the reinvestment of regular cash dividends, but not for the withholding of taxes.
The S&P 500 Equal Weight Index is the equal-weight version of the S&P 500 index. The Index includes the same constituents as the S&P 500, but each company is allocated a fixed weight of 0.2% of the Index total at each quarterly rebalance. The Index returns assume daily reinvestment of dividends and do not reflect any fees or expenses.
Index data referenced herein is the property of S&P Dow Jones Indices LLC, a division of S&P Global Inc., its affiliates ("S&P") and/or its third party suppliers and has been licensed for use by Manning & Napier. S&P and its third party suppliers accept no liability in connection with its use. Data provided is not a representation or warranty, express or implied, as to the ability of any index to accurately represent the asset class or market sector that it purports to represent and none of these parties shall have any liability for any errors, omissions, or interruptions of any index or the data included therein. For additional disclosure information, please see: go.manning-napier.com/benchmark-provisions
The MSCI USA Growth Index is designed to measure large and mid-cap US securities exhibiting overall growth style characteristics. The Index returns do not reflect any fees or expenses. The Index is denominated in U.S. dollars. The Index returns are net of withholding taxes. They assume daily reinvestment of net dividends thus accounting for any applicable dividend taxation.
The MSCI USA Small Cap Index is designed to measure the performance of the small cap segment of the US equity market. The index represents approximately 14% of the free float-adjusted market capitalization in the US. The Index returns do not reflect any fees or expenses. The Index is denominated in U.S. dollars. The Index returns are net of withholding taxes. They assume daily reinvestment of net dividends thus accounting for any applicable dividend taxation.
The MSCI ACWI ex USA Index is designed to measure large and mid-cap representation across 22 of 23 Developed Markets countries (excluding the U.S.) and 24 Emerging Markets countries. The Index returns do not reflect any fees or expenses. The Index is denominated in U.S. dollars. The Index returns are net of withholding taxes. They assume daily reinvestment of net dividends thus accounting for any applicable dividend taxation.
The MSCI USA Value Index is designed to measure large and mid-cap US securities exhibiting overall value style characteristics. The Index returns do not reflect any fees or expenses. The Index is denominated in U.S. dollars. The Index returns are net of withholding taxes. They assume daily reinvestment of net dividends thus accounting for any applicable dividend taxation.
Index data referenced herein is the property of MSCI, its affiliates ("MSCI") and/or its third party suppliers and has been licensed for use by Manning & Napier. MSCI and its third party suppliers accept no liability in connection with its use. Data provided is not a representation or warranty, express or implied, as to the ability of any index to accurately represent the asset class or market sector that it purports to represent and none of these parties shall have any liability for any errors, omissions, or interruptions of any index or the data included therein. For additional disclosure information, please see: https://go.manning-napier.com/benchmark-provisions.
Morningstar, Inc. is a global investment research firm providing data, information, and analysis of stocks and mutual funds. ©2026 Morningstar, Inc. All rights reserved. The information contained herein: (1) is proprietary to Morningstar and/or its content providers; (2) may not be copied, adapted or distributed; and (3) is not warranted to be accurate, complete or timely. Neither Morningstar nor its content providers are responsible for any damages or losses arising from any use of this information, except where such damages or losses cannot be limited or excluded by law in your jurisdiction. Past financial performance is no guarantee of future results.